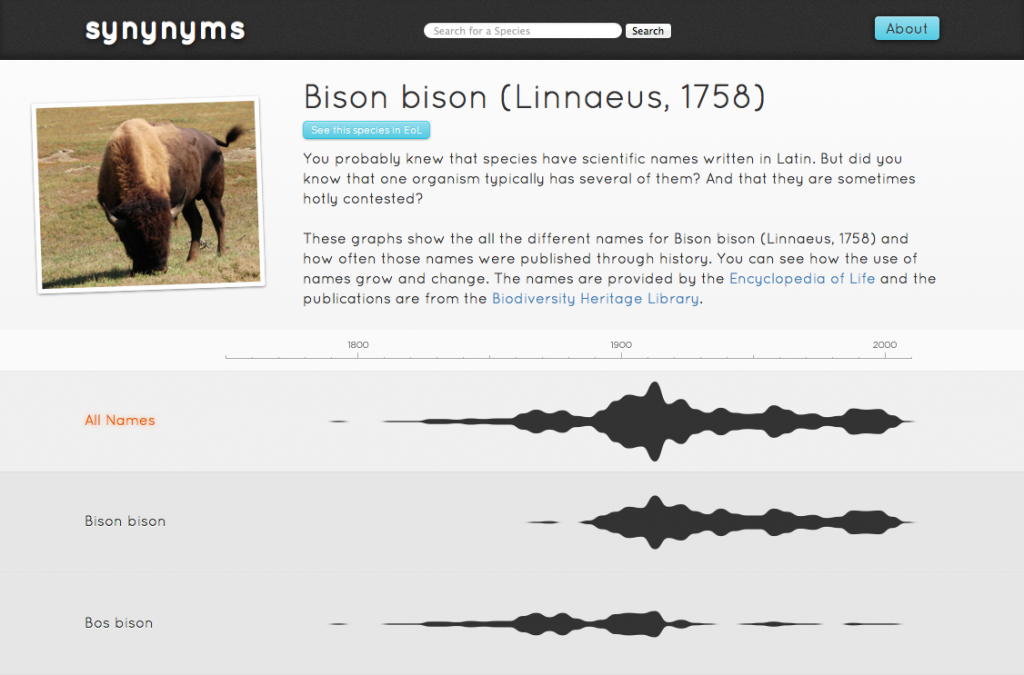
Synynyms is an award-winning tool that I wrote for visualizing the scientific names of species. You see, most species don’t just have one scientific name, they typically have many, which are sometimes hotly contested! Synynyms graphs the popularity of each these names through time, as can be seen in the graphs below of the American Bison, which changed names from Bos bison to Bison bison in the early 20th Century.

Synynyms ties together the APIs of three important biodiversity informatics projects. The names and taxonomic synonyms themselves come from the Encyclopedia of Life, those names are parsed into their components by the Global Names Index, and most importantly of all, the publication occurrences come from the Biodiversity Heritage Library.
Because the datasets are large and take a long time to download, I wrote this tool in Node.js and Socket.io to facilitate realtime graphing in the client. As vast amounts of data stream in from the web services, the Node server parses and analyzes the data, then sends it to the client over a WebSocket, thus allowing the user to watch the graphs build themselves in realtime. The graphs act as their own progress bars. Up front, I used Backbone to keep the front end sane, and Raphael to draw the graphs themselves.